使用Canal + ClickHouse实时分析MySQL事务信息 作为DBA, 有时候我们会希望能够了解线上核心库更具体的”样貌”, 如:
这个库主要的DML类型是什么?
这个库的事务大小, 执行时间, 影响行数大概是什么样的?
以上信息也许没什么价值, 但大事务对复制的影响不用多说, 并且当我们希望升级当前主从架构到MGR/PXC等高可用方案的场景时以上信息就比较重要了(毕竟用数据说话更有力度).
大事务对MGR和PXC都是不友好的, 尤其是MGR(起码在5.7版本)严重时会导致整个集群hang死
在Galera 4.0中新特性Streaming Replication 对大事务有了更好的支持
当然, 有人可能会说, 通过分析binlog就可以完成这样的工作, 最简单的方法写个shell脚本就可以, 比如这篇文章中介绍的方法Identifying Useful Info from MySQL Row-Based Binary Logs (这篇文章介绍的方法比较简单, 分析速度也较慢, 可以试试analysis_binlog ). 当然还有很多其他工具, 比如infobin.
但个人认为上面的方法从某种角度来看还是比较麻烦, 而且现在ClickHouse越来越流行, 使用ClickHouse去完成这个工作也能帮助我们更好的学习ClickHouse
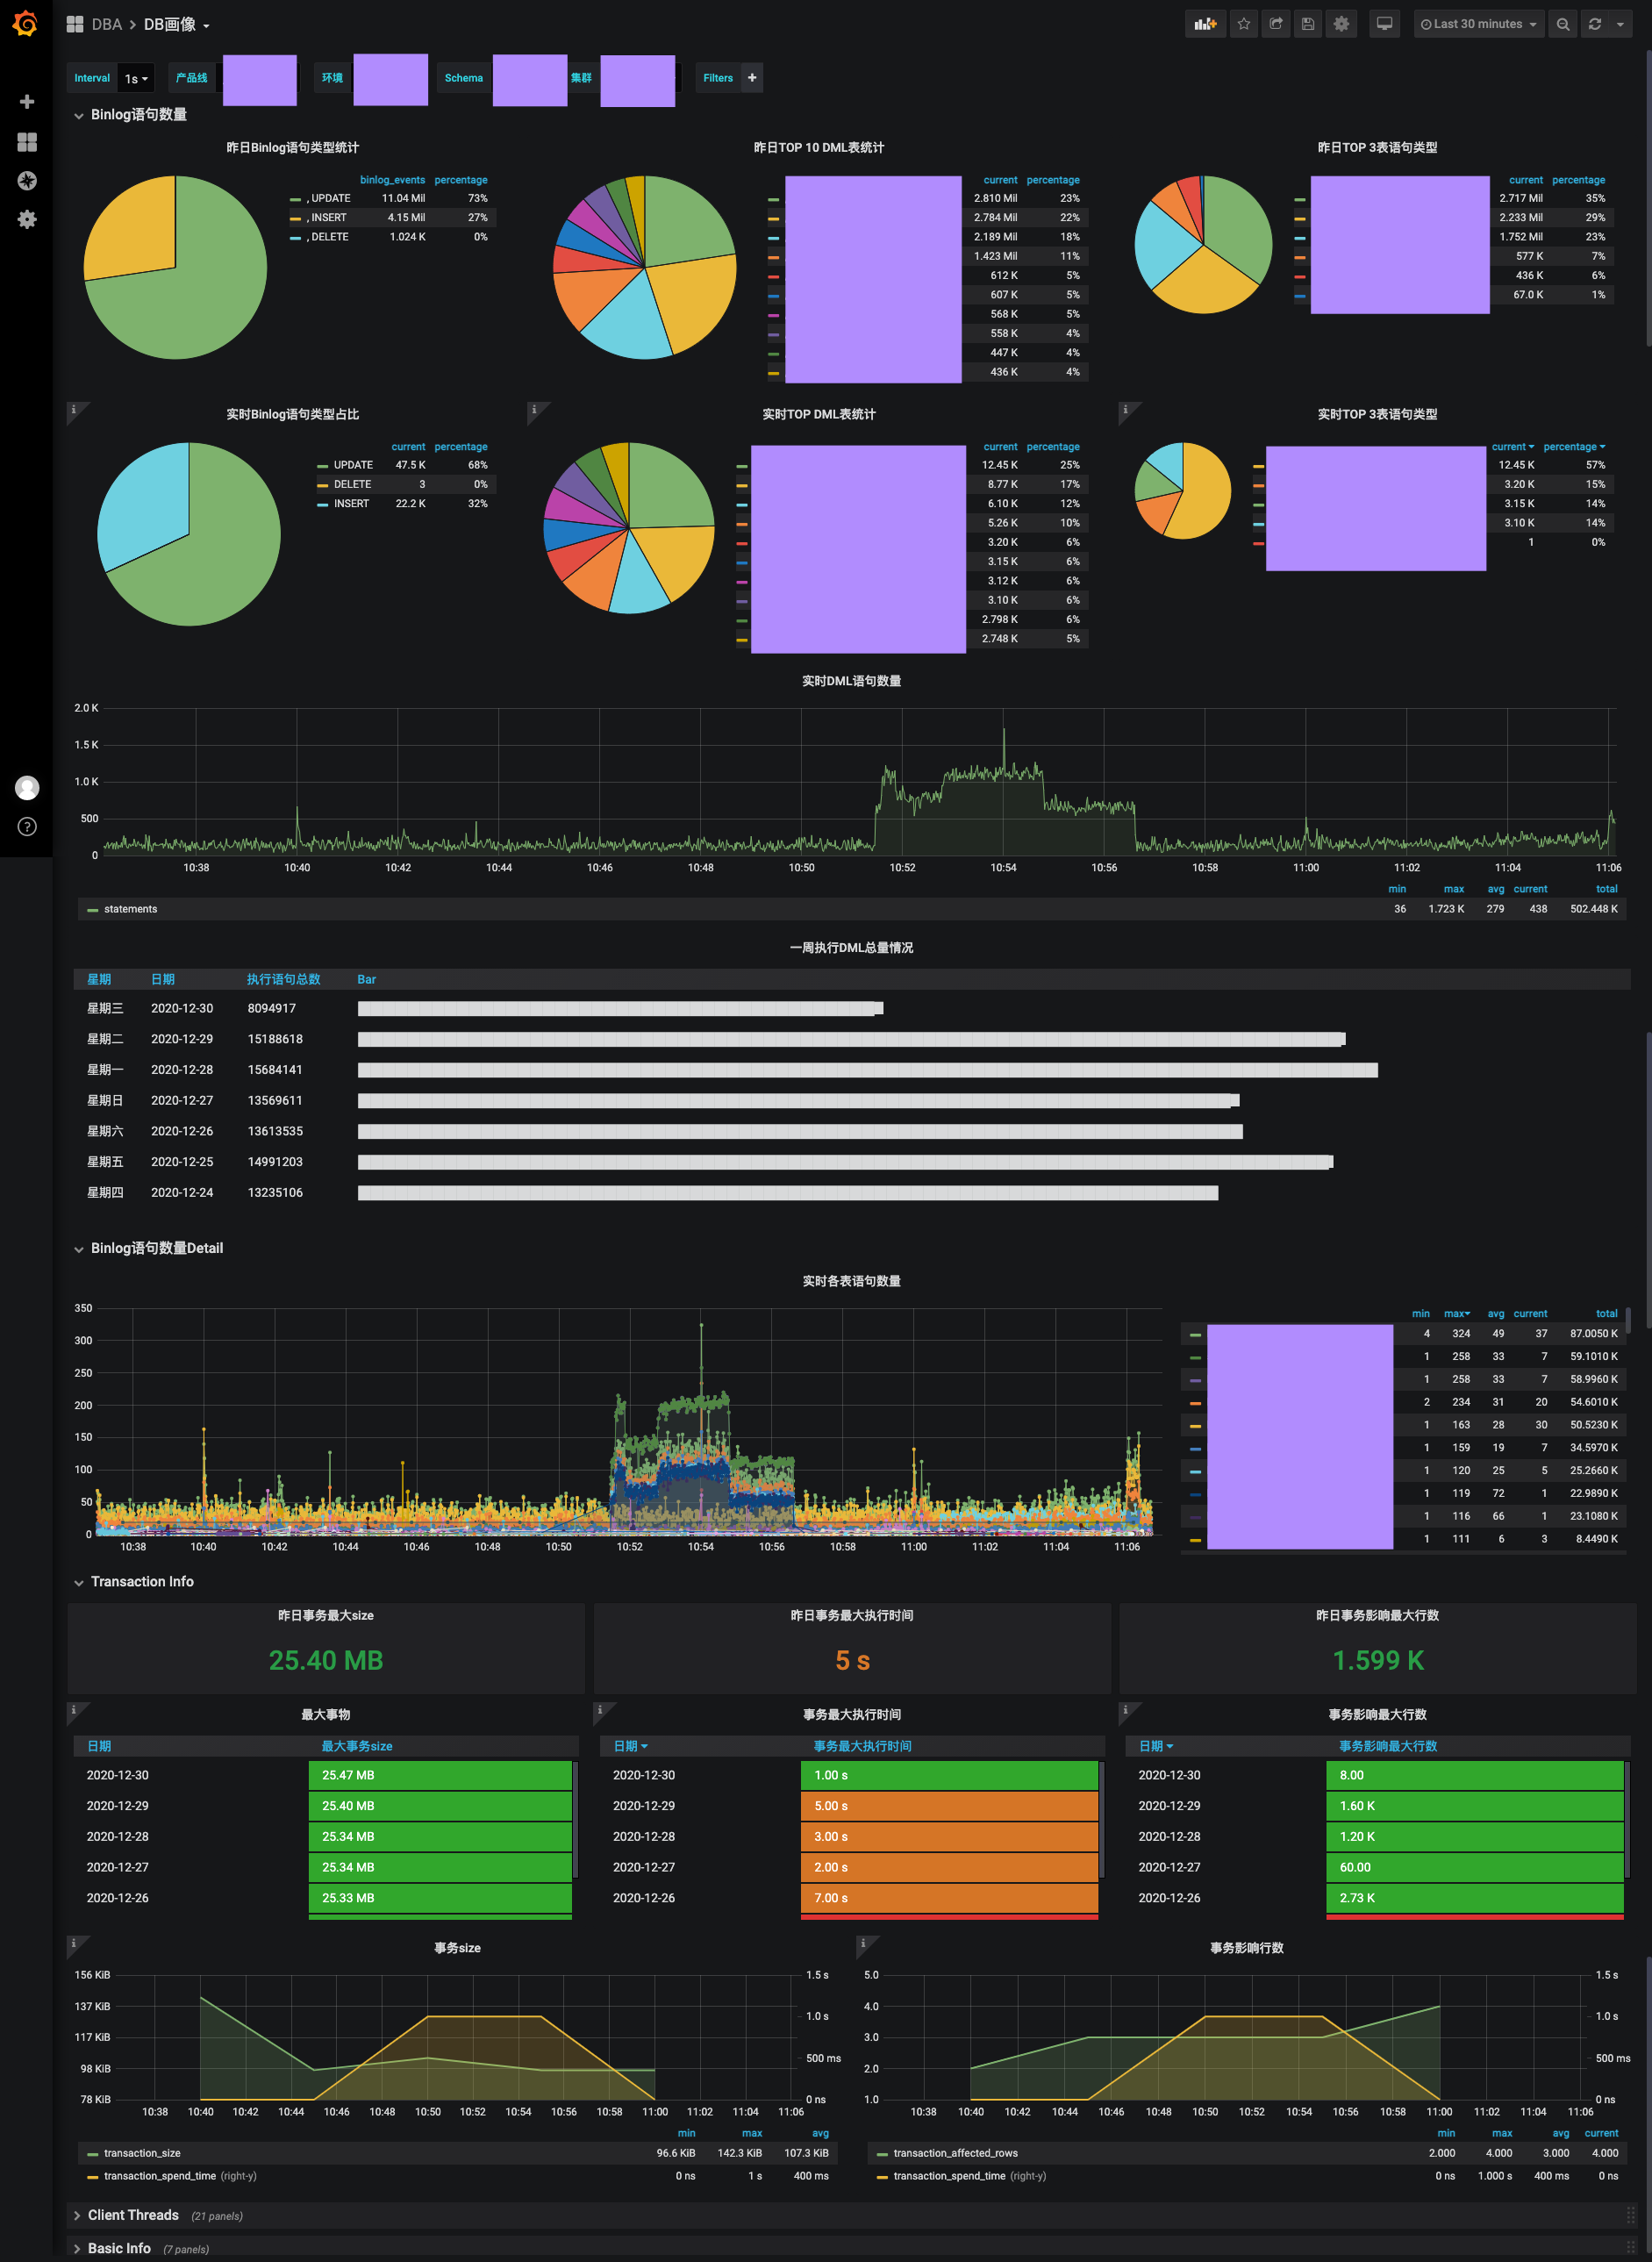
先看一下最终的成果
实现方法
canal + kafka
部署canal , 订阅线上库的binlog, 写入到kafka 我这里没有使用flatMessage(canal.mq.flatMessage = false), 写入到kafka的消息是二进制的protobuf格式的, 当然也可以开启flatMessage, 那么写到kafka的消息就是json格式的.
消费binlog, 持久化到clickhouse
具体代码详见 https://github.com/Fanduzi/Use_clickhouse_2_analyze_mysql_binlog
clickhouse表
基础表 canal消费后直接写入
1 2 3 4 5 6 7 8 9 10 11 12 13 14 15 16 17 18 19 20 21 22 23 24 25 26 27 28 29 30 31 32 33 34 35 36 37 38 39 40 41 CREATE TABLE mysql_monitor.broker_binlog_local( `schema` String COMMENT '数据库名' , `table` String COMMENT '表名' , `event_type` String COMMENT '语句类型' , `is_ddl` UInt8 COMMENT 'DDL 1 else 0' , `binlog_file` String COMMENT 'binlog文件名' , `binlog_pos` String COMMENT 'binlog pos' , `characterset` String COMMENT '字符集' , `execute_time` DateTime COMMENT '执行的时间' , `gtid` String COMMENT 'gtid' , `single_statement_affected_rows` UInt32 COMMENT '此语句影响行数' , `single_statement_size` String DEFAULT '0' COMMENT '此语句size,单位bytes' , `ctime` DateTime DEFAULT now () COMMENT '写入clickhouse时间' ) ENGINE = ReplicatedMergeTree('/clickhouse/mysql_monitor/tables/{layer}-{shard}/broker_binlog' , '{replica}' )PARTITION BY toDate(execute_time)ORDER BY (execute_time, gtid, table , schema )TTL execute_time + toIntervalMonth(30 ) SETTINGS index_granularity = 8192 CREATE TABLE mysql_monitor.broker_binlog( `schema` String COMMENT '数据库名' , `table` String COMMENT '表名' , `event_type` String COMMENT '语句类型' , `is_ddl` UInt8 COMMENT 'DDL 1 else 0' , `binlog_file` String COMMENT 'binlog文件名' , `binlog_pos` String COMMENT 'binlog pos' , `characterset` String COMMENT '字符集' , `execute_time` DateTime COMMENT '执行的时间' , `gtid` String COMMENT 'gtid' , `single_statement_affected_rows` UInt32 COMMENT '此语句影响行数' , `single_statement_size` String DEFAULT '0' COMMENT '此语句size,单位bytes' , `ctime` DateTime DEFAULT now () COMMENT '写入clickhouse时间' ) ENGINE = Distributed ('ch_cluster_all' , 'mysql_monitor' , 'broker_binlog_local' , rand ())
统计用表
SummingMergeTree
ClickHouse会将所有具有相同主键(或更准确地说, 具有相同sorting key)的行替换为包含具有数字数据类型的列的汇总值的一行
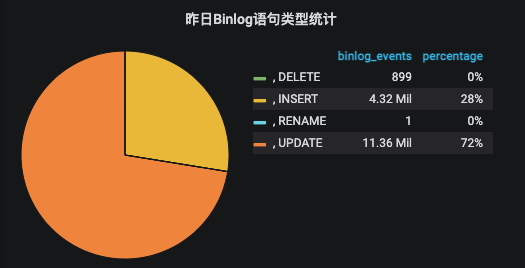
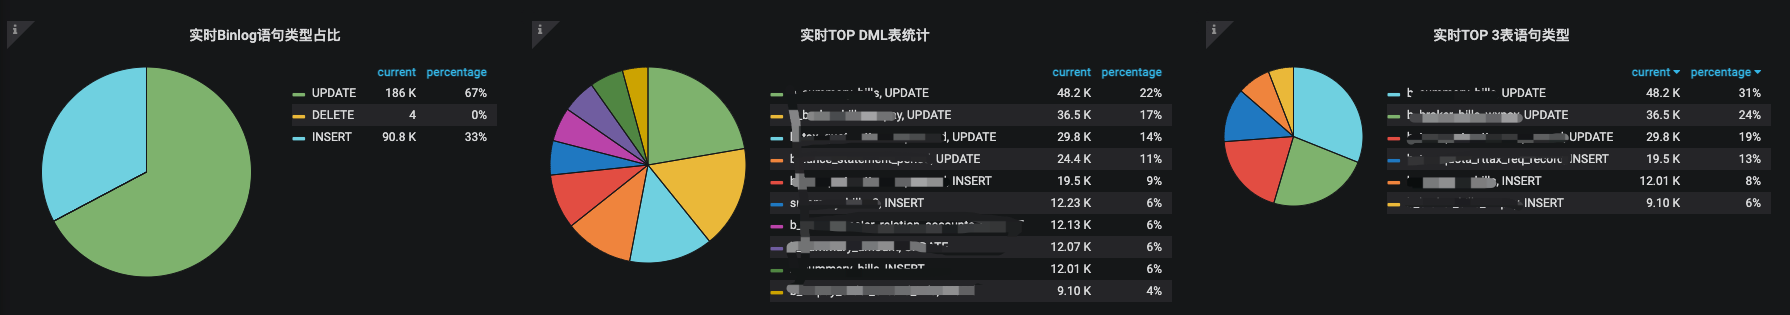
每天binlog 各个event_type数量 用于统计每日整体binlog event类型占比
1 2 3 4 5 6 7 8 9 10 11 12 13 14 15 16 17 18 19 20 21 22 23 24 25 26 27 28 29 30 31 32 33 34 35 36 37 38 39 40 41 CREATE TABLE mysql_monitor.broker_daily_binlog_event_count_local ON CLUSTER ch_cluster_all( `day` Date , `event_type` String , `event_count` UInt64 ) ENGINE = ReplicatedSummingMergeTree('/clickhouse/mysql_monitor/tables/{layer}-{shard}/broker_daily_binlog_event_count' , '{replica}' )PARTITION BY day ORDER BY (day , event_type)TTL day + toIntervalMonth(30 ) SETTINGS index_granularity = 8192 CREATE MATERIALIZED VIEW mysql_monitor.broker_daily_binlog_event_count_mv_local ON CLUSTER ch_cluster_all TO mysql_monitor.broker_daily_binlog_event_count_local( `day` Date , `event_type` String , `event_count` UInt64 ) AS SELECT toDate(execute_time) AS day , event_type, count (*) AS event_count FROM mysql_monitor.broker_binlog_localGROUP BY day , event_type ORDER BY day ASC , event_type ASC CREATE TABLE mysql_monitor.broker_daily_binlog_event_count_mv ON CLUSTER ch_cluster_all( `day` Date , `event_type` String , `event_count` UInt64 ) ENGINE = Distributed ('ch_cluster_all' , 'mysql_monitor' , 'broker_daily_binlog_event_count_mv_local' , rand ())
grafana中查询语句
1
2
3
4
5
6
7
8
SELECT day as t, event_type, sum (event_count) FROM mysql_monitor.${prefix}_daily_binlog_event_count_mvWHERE day = yesterday() and event_type!='QUERY' and event_type!='EVENTTYPECOMPATIBLEPROTO2' GROUP BY day , event_type
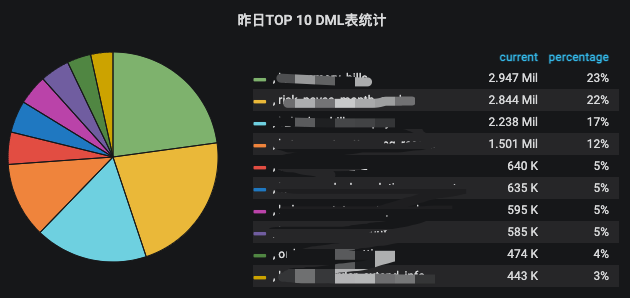
每日TOP DML表统计
1 2 3 4 5 6 7 8 9 10 11 12 13 14 15 16 17 18 19 20 21 22 23 24 25 26 27 28 29 30 31 32 33 34 35 36 37 38 39 40 41 42 43 44 45 46 47 48 49 50 51 52 CREATE TABLE mysql_monitor.broker_daily_binlog_event_count_by_table_local ON CLUSTER ch_cluster_all( `day` Date , `schema` String , `table` String , `event_type` String , `event_count` UInt64 ) ENGINE = ReplicatedSummingMergeTree('/clickhouse/mysql_monitor/tables/{layer}-{shard}/broker_daily_binlog_event_count_by_table' , '{replica}' )PARTITION BY day ORDER BY (day , table , schema , event_type)TTL day + toIntervalMonth(30 ) SETTINGS index_granularity = 8192 CREATE MATERIALIZED VIEW mysql_monitor.broker_daily_binlog_event_count_by_table_mv_local ON CLUSTER ch_cluster_all TO mysql_monitor.broker_daily_binlog_event_count_by_table_local( `day` Date , `schema` String , `table` String , `event_type` String , `event_count` UInt64 ) AS SELECT toDate(execute_time) AS day , schema , table , event_type, count (*) AS event_count FROM mysql_monitor.broker_binlog_localGROUP BY day , schema , table , event_type ORDER BY day ASC , schema ASC , table ASC , event_type DESC CREATE TABLE mysql_monitor.broker_daily_binlog_event_count_by_table_mv ON CLUSTER ch_cluster_all( `day` Date , `schema` String , `table` String , `event_type` String , `event_count` UInt64 ) ENGINE = Distributed ('ch_cluster_all' , 'mysql_monitor' , 'broker_daily_binlog_event_count_by_table_mv_local' , rand ())
grafana中查询语句
1
2
3
4
5
6
7
8
9
10
11
SELECT day as t, table , sum (event_count) count FROM mysql_monitor.${prefix}_daily_binlog_event_count_by_table_mvWHERE day = yesterday() and event_type!='QUERY' and event_type!='EVENTTYPECOMPATIBLEPROTO2' GROUP BY day , table ORDER BY count desc LIMIT 10
grafana中查询语句
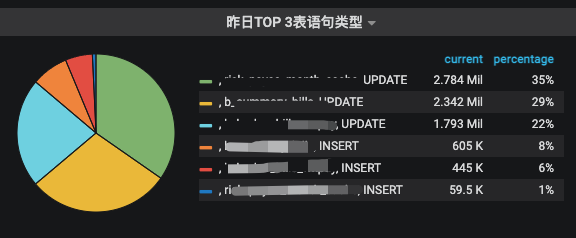
1
2
3
4
5
6
7
8
9
10
11
12
13
14
15
16
17
SELECT day as t, table , event_type, sum (event_count) count FROM mysql_monitor.${prefix}_daily_binlog_event_count_by_table_mvWHERE day = yesterday() and event_type!='QUERY' and event_type!='EVENTTYPECOMPATIBLEPROTO2' and table GLOBAL IN ( select table from ( select table , sum (event_count) count FROM mysql_monitor.${prefix}_daily_binlog_event_count_by_table_mv WHERE day = yesterday() GROUP BY table order by count desc limit 3 )) GROUP BY day , table , event_type ORDER BY count DESC
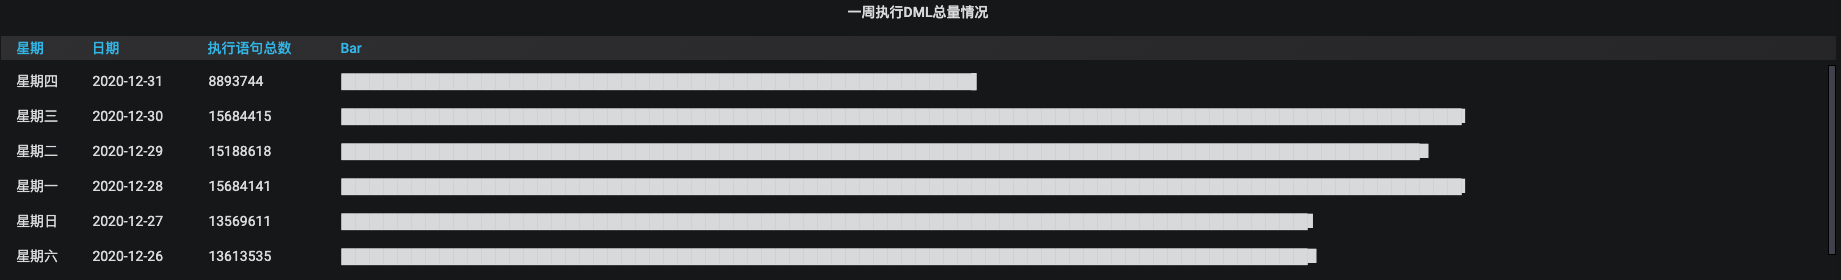
一周执行DML总量情况
1
2
3
4
5
6
7
8
9
10
11
12
13
14
WITH ( SELECT sum (event_count) FROM mysql_monitor.${prefix}_daily_binlog_event_count_mv WHERE (day >= (today() - 6 )) AND (event_type != 'QUERY' ) AND (event_type != 'EVENTTYPECOMPATIBLEPROTO2' ) ) AS total_statement_count SELECT multiIf(toDayOfWeek(day ) = 1 , '星期一' , toDayOfWeek(day ) = 2 , '星期二' , toDayOfWeek(day ) = 3 , '星期三' , toDayOfWeek(day ) = 4 , '星期四' , toDayOfWeek(day ) = 5 , '星期五' , toDayOfWeek(day ) = 6 , '星期六' , toDayOfWeek(day ) = 7 , '星期日' , 'N/A' ) AS w, day AS t, sum (event_count) AS statement_count, bar(statement_count, 0 , total_statement_count, 500 ) AS bar FROM mysql_monitor.${prefix}_daily_binlog_event_count_mvWHERE (day >= (today() - 6 )) AND (event_type != 'QUERY' ) AND (event_type != 'EVENTTYPECOMPATIBLEPROTO2' )GROUP BY day ORDER BY toDate(t) DESC
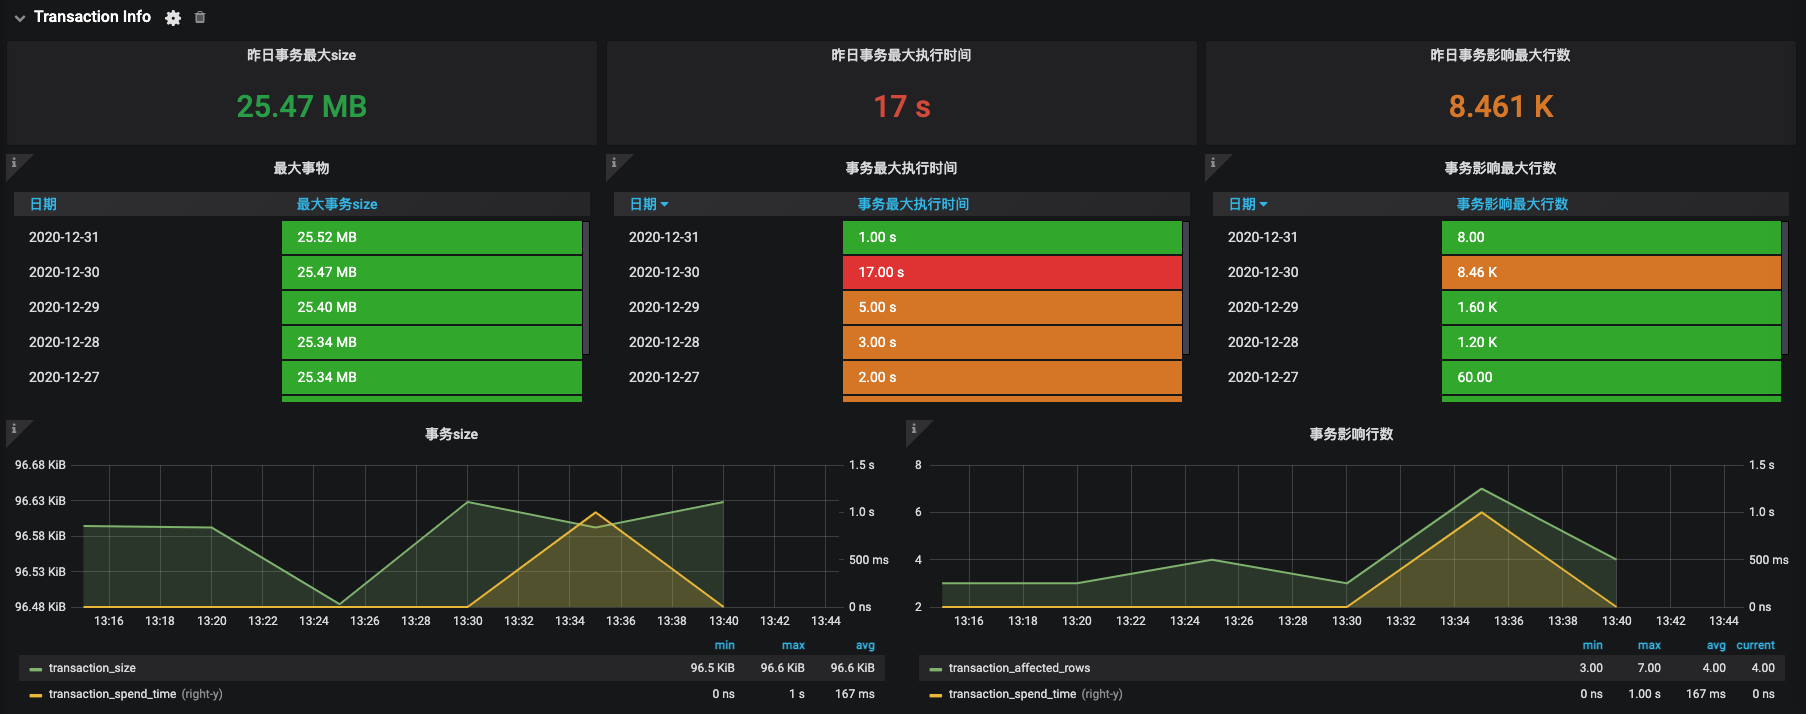
事务情况统计
统计影响行数对多的事务, 产生binlog最大的事务, 执行时间最长的事务
1
2
3
4
5
6
7
8
9
10
11
12
13
14
15
16
17
18
19
20
21
22
23
24
25
26
27
28
29
30
31
32
33
34
35
36
37
38
39
40
41
42
43
44
45
46
47
48
49
50
51
52
53
54
55
56
57
58
59
60
61
62
63
64
65
66
67
68
69
70
71
72
73
74
75
76
77
78
CREATE TABLE mysql_monitor.broker_largest_transaction_local ON CLUSTER ch_cluster_all( `end_time` DateTime COMMENT '采集语句中的end_time' , `invertal` String COMMENT '采集周期,单位秒' , `gtid` String COMMENT 'gtid' , `transaction_spend_time` Int32 COMMENT '事务用时' , `transaction_size` Int64 COMMENT '事务size' , `single_statement_affected_rows` UInt64 COMMENT '事务影响行数' ) ENGINE = ReplicatedSummingMergeTree('/clickhouse/mysql_monitor/tables/{layer}-{shard}/broker_largest_transaction' , '{replica}' )PARTITION BY toDate(end_time)ORDER BY gtidTTL toDate(end_time) + toIntervalMonth(30 ) SETTINGS index_granularity = 8192 CREATE TABLE mysql_monitor.broker_largest_transaction ON CLUSTER ch_cluster_all( `end_time` DateTime COMMENT '采集语句中的end_time' , `invertal` String COMMENT '采集周期,单位秒' , `gtid` String COMMENT 'gtid' , `transaction_spend_time` Int32 COMMENT '事务用时' , `transaction_size` Int64 COMMENT '事务size' , `single_statement_affected_rows` UInt64 COMMENT '事务影响行数' ) ENGINE = Distributed ('ch_cluster_all' , 'mysql_monitor' , 'broker_largest_transaction_local' , rand ())CREATE TABLE mysql_monitor.broker_most_time_consuming_transaction_local ON CLUSTER ch_cluster_all( `end_time` DateTime COMMENT '采集语句中的end_time' , `invertal` String COMMENT '采集周期,单位秒' , `gtid` String COMMENT 'gtid' , `transaction_spend_time` Int32 COMMENT '事务用时' , `transaction_size` Int64 COMMENT '事务size' , `single_statement_affected_rows` UInt64 COMMENT '事务影响行数' ) ENGINE = ReplicatedSummingMergeTree('/clickhouse/mysql_monitor/tables/{layer}-{shard}/broker_most_time_consuming_transaction' , '{replica}' )PARTITION BY toDate(end_time)ORDER BY gtidTTL toDate(end_time) + toIntervalMonth(30 ) SETTINGS index_granularity = 8192 CREATE TABLE mysql_monitor.broker_most_time_consuming_transaction ON CLUSTER ch_cluster_all( `end_time` DateTime COMMENT '采集语句中的end_time' , `invertal` String COMMENT '采集周期,单位秒' , `gtid` String COMMENT 'gtid' , `transaction_spend_time` Int32 COMMENT '事务用时' , `transaction_size` Int64 COMMENT '事务size' , `single_statement_affected_rows` UInt64 COMMENT '事务影响行数' ) ENGINE = Distributed ('ch_cluster_all' , 'mysql_monitor' , 'broker_most_time_consuming_transaction_local' , rand ())CREATE TABLE mysql_monitor.broker_most_affected_rows_transaction_local ON CLUSTER ch_cluster_all( `end_time` DateTime COMMENT '采集语句中的end_time' , `invertal` String COMMENT '采集周期,单位秒' , `gtid` String COMMENT 'gtid' , `transaction_spend_time` Int32 COMMENT '事务用时' , `transaction_size` Int64 COMMENT '事务size' , `single_statement_affected_rows` UInt64 COMMENT '事务影响行数' ) ENGINE = ReplicatedSummingMergeTree('/clickhouse/mysql_monitor/tables/{layer}-{shard}/broker_most_affected_rows_transaction' , '{replica}' )PARTITION BY toDate(end_time)ORDER BY gtidTTL toDate(end_time) + toIntervalMonth(30 ) SETTINGS index_granularity = 8192 CREATE TABLE mysql_monitor.broker_most_affected_rows_transaction ON CLUSTER ch_cluster_all( `end_time` DateTime COMMENT '采集语句中的end_time' , `invertal` String COMMENT '采集周期,单位秒' , `gtid` String COMMENT 'gtid' , `transaction_spend_time` Int32 COMMENT '事务用时' , `transaction_size` Int64 COMMENT '事务size' , `single_statement_affected_rows` UInt64 COMMENT '事务影响行数' ) ENGINE = Distributed ('ch_cluster_all' , 'mysql_monitor' , 'broker_most_affected_rows_transaction_local' , rand ())
想了想只能建三张表, 写脚本自己周期性查询size,耗时, 影响行数最多的在插入这些表中
查询语句大致如下, 由于grafana必须需要一个DateTime列, 所以加了一个toDateTime('{end}') 取每次采集窗口的高水位. 三个查询只是order by不同
1
2
3
4
5
6
7
8
9
10
11
12
13
14
15
16
17
18
19
20
21
22
23
24
25
26
27
28
29
30
31
32
33
34
35
36
37
38
39
40
41
42
43
44
45
46
47
48
49
50
51
52
53
54
55
56
57
58
59
60
61
62
63
64
65
66
67
68
69
70
71
72
73
74
75
76
77
78
79
80
81
82
83
84
85
86
87
88
89
90
91
92
昨日最大事物size SELECT $timeSeries as t, sum (transaction_size) sum_transaction_size FROM mysql_monitor.${prefix}_largest_transactionWHERE end_time>=toDateTime(yesterday()) and end_time<toDateTime(today())GROUP BY t,gtidORDER BY sum_transaction_size desc limit 1 昨日事务最大执行时间 SELECT $timeSeries as t, sum (transaction_spend_time) sum_transaction_spend_time FROM mysql_monitor.${prefix}_most_time_consuming_transactionWHERE end_time>=toDateTime(yesterday()) and end_time<toDateTime(today())GROUP BY t,gtidORDER BY sum_transaction_spend_time desc limit 1 昨日事务影响最大行数 SELECT $timeSeries as t, sum (single_statement_affected_rows) transaction_affected_rows FROM mysql_monitor.${prefix}_most_affected_rows_transactionWHERE end_time>=toDateTime(yesterday()) and end_time<toDateTime(today())GROUP BY t,gtidORDER BY transaction_affected_rows desc limit 1 上周最大事物概览 select t,max (sum_transaction_size) max_transaction_size from (SELECT toDate(end_time) as t, gtid, sum (transaction_size) sum_transaction_size FROM mysql_monitor.${prefix}_largest_transactionWHERE end_time >= (today() - 6 )GROUP BY t,gtid) group by t order by t desc 上周事务最大执行时间概览 select t,max (sum_transaction_spend_time) max_transaction_spend_time from (SELECT toDate(end_time) as t, gtid, sum (transaction_spend_time) sum_transaction_spend_time FROM mysql_monitor.${prefix}_most_time_consuming_transactionWHERE end_time >= (today() - 6 )GROUP BY t,gtid) group by t order by t desc 上周事务影响最大行数概览 select t,max (transaction_affected_rows) max_transaction_affected_rows from (SELECT toDate(end_time) as t, gtid, sum (single_statement_affected_rows) transaction_affected_rows FROM mysql_monitor.${prefix}_most_affected_rows_transactionWHERE end_time >= (today() - 6 )GROUP BY t,gtid) group by t order by t desc 近实时事务size 图 SELECT $timeSeries as t, sum (transaction_size) transaction_size FROM mysql_monitor.${prefix}_largest_transactionWHERE $timeFilterGROUP BY t, gtidORDER BY tSELECT $timeSeries as t, sum (transaction_spend_time) transaction_spend_time FROM mysql_monitor.${prefix}_most_time_consuming_transactionWHERE $timeFilterGROUP BY t, gtidORDER BY t近实时事务影响行数图 SELECT $timeSeries as t, sum (single_statement_affected_rows) transaction_affected_rows FROM mysql_monitor.${prefix}_most_affected_rows_transactionWHERE $timeFilterGROUP BY t, gtidORDER BY tSELECT $timeSeries as t, sum (transaction_spend_time) transaction_spend_time FROM mysql_monitor.${prefix}_most_time_consuming_transactionWHERE $timeFilterGROUP BY t, gtidORDER BY t
总结 实际干下来发现一些查询确实可以通过物化视图优化, 但是grafana每次都要带一个DateTime比较烦, 可能物化视图还有优化空间. 对于如下图所示的实时统计的需求daily_binlog这种天级物化视图就无法实现细粒度的查询了(查询速度太慢, 必须借助物化视图)
那么如何实现更细粒度的物化视图呢? 得看下如何按周期聚合, 比如5分钟一个聚合. 目前clickhouse没有oracle那样的开窗函数
oracle可以
sum over(partition by gtid order by execute_time range between interval ‘1’ day preceding and interval ‘1’ day following)
对于一些不好优化的查询, 如果换马蜂窝那些一天上百G binlog的库可能真的跑不动了. 也许只能多搞几个分片, 不过不知道最后聚合会不会很耗内存, 感觉最主要是这套系统是否值得付出加节点的金钱成本.